Dec 22, 2025
Learn average food cost for a restaurant and steps to improve profits
So, what’s the magic number for food cost? For most independent restaurants, the sweet spot is between 28–35% of your total sales.
Letting that number creep up is a recipe for disaster, especially when rising supplier prices are already squeezing your margins. This guide gives you the benchmarks, formulas, and actionable steps to get your food cost under control.
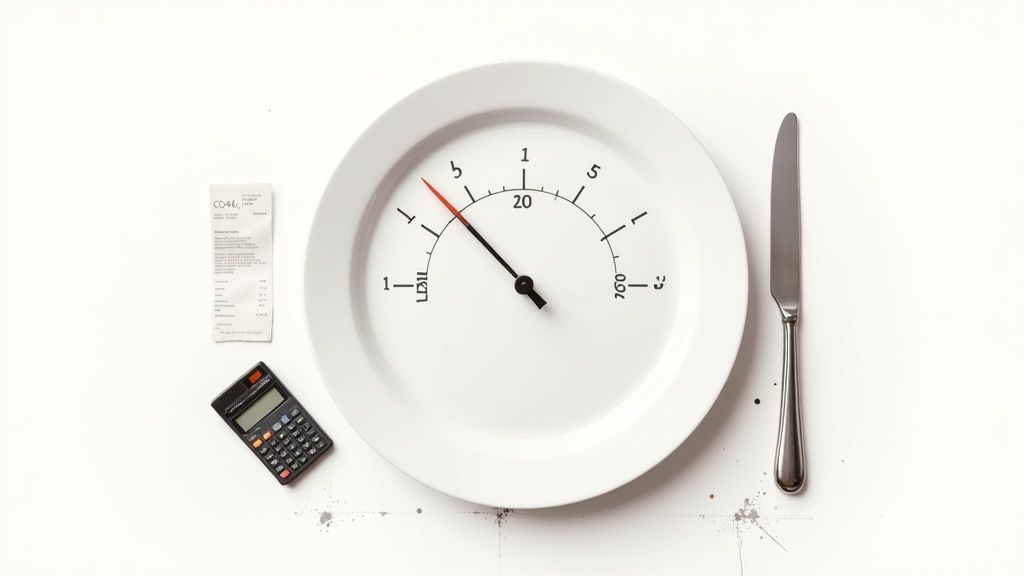
Think of your food cost percentage like a car's fuel gauge. If you’re burning fuel too quickly, you won’t make it to profitability. With the global restaurant industry growth projected to continue, every percentage point counts. Food costs are a huge piece of the puzzle, but you also have labor costs hovering around 36% of revenue. It's a constant balancing act.
These are the core numbers you need to watch:
These benchmarks are your guardrails. They tell you if you’re on track or veering into the danger zone, helping you spot a problem before it gets out of control.
Staying within that 28–35% food cost window creates breathing room. This protects you from unexpected spikes in ingredient prices that can throw everything off balance.
These numbers aren't set in stone. Seasonal supply shifts can push up your food costs. Local regulations and regional tastes also influence your ideal percentage. The key is to stay flexible. Adjust your targets by watching local price trends and planning your menu around seasonal availability.
Ready for a quick reality check?
Now that you have your benchmarks, let's calculate your detailed food cost percentage. If you want to automate this process, Peppr's dashboard can sync your sales and inventory data to track your food cost in real-time.
Knowing your target is one thing; nailing down your actual number is how you start protecting profits. Too many operators run on gut feelings, which is like navigating a dinner rush blindfolded. The good news? The math is simple.
The industry-standard formula for calculating your total food cost over a set period (usually a week) looks like this:
Food Cost % = (Beginning Inventory + Purchases – Ending Inventory) ÷ Total Food Sales
Let's break down each term:
The first part of the formula—Beginning Inventory + Purchases – Ending Inventory—gives you your Cost of Goods Sold (COGS). It's the exact cost of the ingredients that went into the food you actually sold.
Let's see how this works for a bistro calculating its food cost for one week:
Now, we plug those numbers into the formula:
($8,000 + $4,000 – $7,500) ÷ $15,000
$4,500 (COGS) ÷ $15,000 (Food Sales) = 0.30
Multiply by 100, which gives us 30%. This bistro is right in the healthy 28-35% range.
Your overall food cost percentage is your kitchen's report card. It tells you if you're on track. But it won't tell you where you might be leaking profits. That's where plate costing comes in.
Calculating the exact cost of every ingredient in a dish is more detailed, but the insight is priceless. You might have a high-margin pasta dish secretly covering for a low-margin steak special. Calculating both gives you the complete story, letting you make smart decisions to plug profit leaks.
Trying to hit a single, universal “average” food cost is like using a map for the wrong city. Your ideal food cost percentage depends entirely on your concept and service style. The key is to understand the right benchmark for your restaurant.
The infographic below shows the simple formula for calculating your Cost of Goods Sold—a core piece of your food cost puzzle.

As you can see, your ingredient cost isn't just what you buy; it's what you actually use. This makes accurate inventory crucial.
Here's a look at typical food cost percentages across different concepts. Use these as starting points, not rigid rules.
Restaurant TypeAverage Food Cost PercentageFine Dining / Upscale Casual30% – 40%Casual Dining / Bistros28% – 33%Quick Service / Fast Casual25% – 30%Pizzerias / Specialized Concepts25% – 30%
Now, let’s explore why these numbers differ so much.
Fine dining spots often have the highest food costs, landing in the 30% to 40% range. This is due to premium ingredients like dry-aged steaks or imported seafood. They make up for it with higher menu prices and a focus on the guest experience.
For a neighborhood bistro, the target tightens to 28% to 33%. These restaurants rely on a mix of moderately priced ingredients and consistent volume. Portion control is critical to keeping margins healthy while balancing approachable prices.
QSR and fast-casual models are built for efficiency, so their food costs must be lean, typically 25% to 30%.
In a high-volume, low-price QSR, every fraction of a percentage point matters. Tight control is the only way to protect thin margins.
These restaurants achieve lower costs through bulk purchasing, simplified menus, and standardized recipes. For a deeper look at how food costs fit into your finances, check out our guide on your overall restaurant profit margin.
Concepts like pizzerias often have a lower food cost, also in the 25% to 30% range. Core ingredients like flour and cheese are relatively inexpensive, allowing for healthy markups. Profitability here depends on managing premium topping costs and encouraging high-margin beverage sales.
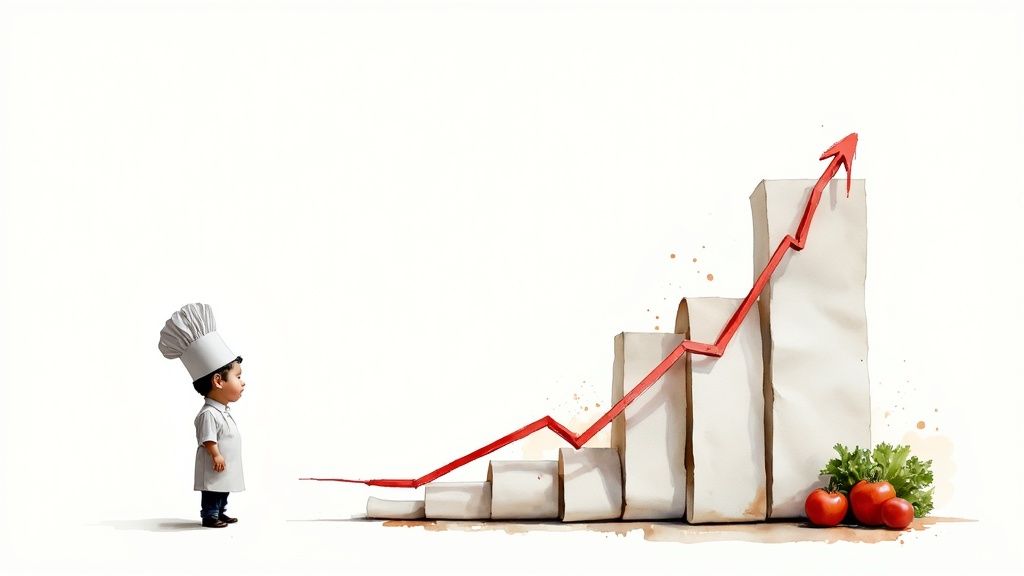
If your supplier invoices are creeping up, you’re not alone. Forces outside your kitchen are pushing costs up for everyone. Understanding these pressures is the first step toward building a smarter purchasing strategy. While the worst of recent volatility has calmed, most projections show prices will continue their slow climb.
The global supply chain is still recovering. Getting ingredients from the farm to your back door is more expensive and less reliable than it used to be. Here’s why:
It’s clear that broader food service industry trends have a huge impact on your bottom line.
The prices you pay are tied to a massive global market. A drought in South America can make your coffee beans more expensive, while geopolitical conflicts can send wheat costs soaring.
Understanding that these forces are outside your control is liberating. It shifts your focus from blaming suppliers to building a proactive strategy that insulates your business from market swings.
Instead of getting frustrated, use this knowledge to your advantage. When you understand the "why" behind a price increase, you can have a more productive conversation with your vendors, ask smarter questions, and work together to find solutions.
Knowing your numbers is the first step. The real change happens on the line, in the walk-in, and at the negotiating table. These are battle-tested tactics you can implement this week.
Your menu is your most powerful sales tool. When designed correctly, it guides guests toward your most profitable items.
Inconsistent portioning is a quiet profit killer. An extra ounce of protein here, a handful of fries there—it adds up to thousands of dollars walking out the door.
Every ingredient that leaves the kitchen without being paid for is a direct hit to your profit. Standardized recipes and portioning tools are your first line of defense.
The solution is standardization. Enforce exact recipes for every dish.
This isn’t about stifling creativity; it’s about ensuring consistency and protecting your margins.
Your suppliers are partners, not adversaries. Strong relationships can unlock savings. Be honest about your goals.
A huge piece of this is mastering inventory management to prevent spoilage and streamline purchasing.
You can't fix what you can't see. Food waste is a direct drain on your profits. Start simple: post a "waste sheet" in the kitchen. Staff must log every item thrown out and the reason why.
Reviewing this sheet daily gives you an immediate, actionable snapshot of where your money is going. For more methods, see our guide on reducing food waste in restaurants.
The U.S. Department of Agriculture forecasts food-away-from-home prices will climb another 3.5% in 2025. With 78% of operators having already raised menu prices in 2024, controlling every possible cost is more critical than ever.
Now it’s time to turn insights into an action plan that protects your bottom line. The goal is building cost control into the weekly rhythm of your restaurant.
Don't get stuck in analysis paralysis. Pick one or two of these to tackle this week.
Consistent, small adjustments add up to significant savings. Start tracking now so cost control becomes an ongoing practice.
Once you have your initial numbers, make tracking a regular part of your routine. Schedule a weekly check-in on your food cost percentage to spot bad trends before they snowball.
As you get comfortable, plug your numbers into a restaurant profit margin calculator. This shows how tiny changes in food cost have a huge impact on overall profitability, connecting daily kitchen efforts to your long-term financial health. This approach turns managing the average food cost for a restaurant into a series of manageable steps.
Here are quick answers to the most common questions we hear from operators.
Calculate it at least once a week. Any less, and you're flying blind. Monthly calculations are too slow; by the time you spot a problem, you’ve already bled profit for four weeks. A weekly check-in lets you react quickly to price hikes or portioning issues.
Track them separately. Beverage costs, especially alcohol, have different margins. A bar might run a cost percentage of 18-24%, much lower than the 28-35% food target.
Lumping them together hides the truth. You might have a great bar program masking a kitchen that's leaking money. Separating them tells you exactly where to focus.
Track food inventory and sales apart from beer, wine, and liquor. This gives you two distinct, actionable numbers instead of one misleading average.
Raising prices is a delicate dance. Instead of a drastic, across-the-board hike, try a more strategic approach.
Ready to stop guessing and start controlling your food costs with precision? Peppr integrates your sales and inventory data, giving you a real-time view of your cost percentages so you can make smarter decisions instantly. See how Peppr can protect your profits today.