Oct 29, 2025
Unlock profits with your POS report and make data-driven decisions for your restaurant's success

Think of your point-of-sale reporting as your restaurant's daily scorecard. It translates every transaction—every appetizer sold, drink poured, and discount applied—into a clear story about your business.
It moves you beyond gut feelings and shows you exactly what's working and what's bleeding you dry.

Running a restaurant on intuition alone is a recipe for disaster. Your Point of Sale (POS) system is much more than a cash register; it’s a data powerhouse designed to give you an edge. The data shows businesses using their POS effectively see a 37% reduction in stockouts and a 24% rise in customer satisfaction.
Instead of guessing, you can know for certain:
The magic isn’t just in having the data; it’s in knowing how to read it. To tap into the insights hiding in your POS, you need to get comfortable with mastering data analysis.
For example, your product mix report might show a popular appetizer has a low profit margin. With that knowledge, you could tweak the ingredients or adjust the portion size. That one small change could add thousands to your annual profit. Understanding these numbers is the first step toward calculating your true financial health. For a deeper dive, use our restaurant profit margin calculator.
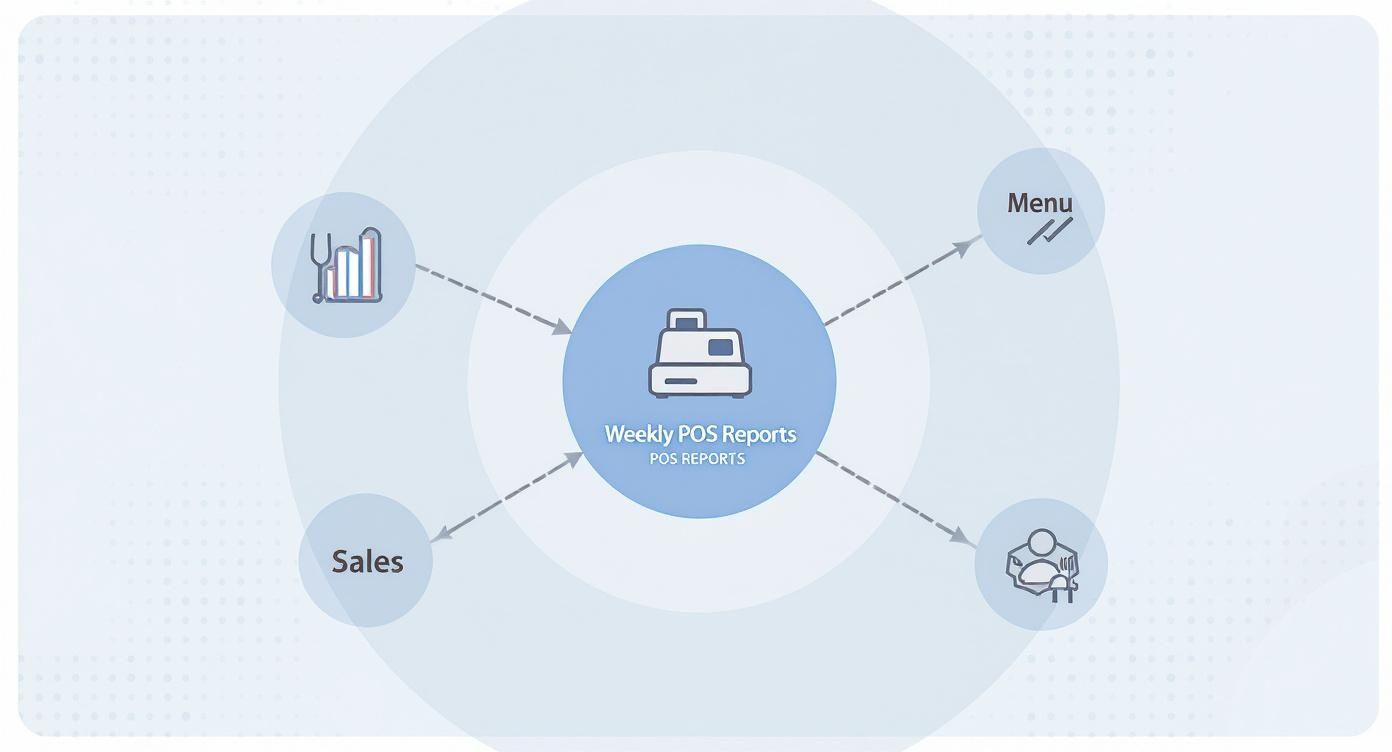
Your POS can generate dozens of reports. It's easy to get lost in the data. To cut through the noise, focus on the vital few that give you the clearest picture of your restaurant's health. Think of these five reports as your non-negotiable weekly check-in.
This is your 30,000-foot view. It shows gross sales, net sales, taxes, tips, and guest counts. It’s the quickest way to take your restaurant's financial pulse. Use it to compare sales day-over-day and week-over-week. Are Tuesday sales always in a slump? Time to launch that weeknight special.
The PMIX tells the story of your menu. It breaks down every item sold, how many you moved, and the revenue each one brought in. This is where you find your all-stars and your benchwarmers.
Quick Win: Pull last week's PMIX and find your top five best-sellers and your bottom five. Feature a top-seller on social media and talk to your chef about whether a bottom-seller is worth the cooler space.
Labor is often your biggest controllable expense, eating up 25-35% of revenue. This report breaks down hours worked and wages paid and stacks it against your sales. The number to live by is your labor cost percentage (Total Labor Cost / Total Sales). Use this report to see if you’re bleeding cash on overstaffing during slow periods.
This report shows you how customers are paying—cash, credit card type, gift cards. It helps you reconcile cash drawers and get a handle on credit card processing fees. A sudden drop in cash payments could also be a red flag for issues at the register.
Think of this as your internal security camera. It details every voided transaction and discount, showing which employee authorized it and why. A high number of voids from one server might mean they need more training or are giving away freebies to friends. Checking this report regularly helps plug financial leaks.
Your Product Mix (PMIX) report is the treasure map that shows which items are goldmines and which are just taking up space. When you combine sales data with your plate costs, you can sort every item into one of four categories. This process, menu engineering, is one of the most powerful moves an owner can make.
Classify each dish based on its popularity and profitability. This grid gives you a clear action plan.
Once sorted, the next steps are clear. For a Plow-horse, could you find a slightly less expensive bun? A tiny change of just $0.25 per plate on an item you sell 100 times a day can add over $9,000 to your annual profit. For Puzzles, run them as a special or retrain servers to recommend them.
The goal isn’t just to sell more food; it's to sell more of the right food. Your PMIX report tells you exactly which items deserve your attention.
As for the Dogs? It’s time to make a tough call. Cutting them simplifies everything from inventory to kitchen prep. To see how small tweaks make a huge impact, see our guide on reducing food waste in restaurants.
The global market for POS terminals was valued at USD 113.38 billion in 2024 and is climbing fast, showing how critical these systems are. You can discover more insights about POS market growth to see where the industry is headed.
As you can see, your menu performance, analyzed through the PMIX, is the pillar that ties sales figures to operational costs.
After food costs, your biggest expense is labor. A slow Tuesday can be as painful as a chaotic Saturday if your schedule is built on guesswork. Your POS reports can turn scheduling from a gamble into a data-driven strategy by pinpointing your actual peak and slow periods.
Stop looking at just total hours worked. Zero in on two metrics that tell the true story of your team's efficiency.
Your historical sales data is a roadmap. Pull reports from last year to get ahead of seasonal rushes or local events.
Don't just schedule for the day; schedule for the hour. If your data shows a massive lunch rush from 12-2 PM followed by a dead zone until 5 PM, use split shifts or stagger start times to match that reality.
Modern POS systems can connect with scheduling software. For example, systems that integrate with tools like 7shifts automatically pull sales data to help build smarter schedules without manual work. You can see how Peppr's 7shifts integration works to streamline this process.
Some of the most valuable insights from your POS aren't about what you've earned—they’re about what you might be losing. Think of these reports as an internal security system, flagging issues like simple training gaps or outright theft.
Learning to spot the difference between a legitimate comp for a cold meal and a pattern of unauthorized freebies is essential for protecting your margins.
You don't need to be a detective, but you need to know where to look. Regularly pulling void, discount, and cash drawer reports shines a light on potential issues.
Your POS reports don't just tell you what you've earned; they show you what you might be losing. A single server with a consistently high void count isn't a coincidence—it's a financial leak.
This isn't about fostering distrust. It’s about maintaining integrity and having data-backed conversations when something looks off.
Scan for these patterns during your weekly review. A single instance might be nothing, but a recurring trend needs a deeper look.
Mobile POS (mPOS) systems have made tracking these transactions easier. With 1.9 billion people using mPOS in 2023, modern systems give you real-time data to spot these red flags instantly. You can learn more about trends in POS technology to see how these advancements can secure your operations.
Here are straight answers to common questions from restaurant owners.
Get into a rhythm. Don't wait until the end of the month to figure out what happened.
It’s easy to get lost. Master the "big five" first for the quickest snapshot of your restaurant’s health.
These five reports give you 80% of the insights you need with 20% of the effort.
If you could only look at one number, it has to be your Labor Cost Percentage. This calculation—total labor cost divided by total sales—is the ultimate balancing act.
Your labor cost percentage tells you if you're scheduling smart or just burning cash. Keeping it in the sweet spot, typically 25-35%, is non-negotiable for survival. It directly reflects how well you’re matching staff to sales.
Your POS reports are your best coaching tool because they’re objective. They shift conversations from "I feel like..." to "The numbers show..."
Pull server-specific reports to track key performance indicators (KPIs) that drive revenue:
Use this data constructively. Set clear goals for your team and spark some friendly competition. Recognizing top performers with a bonus or a better shift based on real numbers is a powerful way to build a culture of excellence.
Ready to stop guessing and start knowing? Peppr gives you the actionable point of sale reports you need to make smarter decisions, control costs, and grow your bottom line. See how our restaurant-first POS can work for you. Get a demo of Peppr today.