Dec 22, 2025
Learn how POS reporting unlocks real-time insights to grow your restaurant

You're juggling a dozen jobs before the lunch rush even starts. Your POS system can feel like just another tool for taking orders and payments. But that’s like using a chef’s knife only to spread butter.
The real power is in point of sale reporting. It turns your sales data into a clear roadmap, showing you what's selling, who's selling it, and when you're busiest. It lets you swap gut feelings for hard facts.

Many owners see their POS as a digital till—a necessary expense. But its most valuable function is often untapped. The real strength of a modern POS is how it collects, organizes, and presents critical business data.
Every order, void, and payment is a piece of a puzzle. When your POS puts them together in a report, you get a complete picture of your restaurant's health.
Point of sale reporting turns thousands of data points into simple, actionable insights. Instead of guessing which specials are profitable, the data gives you direct answers.
A good POS report helps you:
This shift from reactive management to proactive strategy is crucial. The global market for POS terminals is projected to hit USD 181.47 billion by 2030, driven by restaurants relying on this data to stay competitive. You can read more about these POS market trends.
Your POS isn't just a machine for taking money; it's the data-driven heart of your operation.
You're swamped. You don't have time to dig through dozens of reports. The key is focusing on the vital few that directly impact your bottom line.
Think of it like your prep list—you only chop what you need for service. The same applies to point of sale reporting. Let's zero in on the essentials for running a more profitable shift.
This is your most fundamental report, but the real power is in the details. Don't just glance at the daily total. Break it down to see the full story.
Quick Win: Pull your sales-by-item report for the last month. Find your top five sellers and brainstorm one way to promote them this week, like a quick social media post or a verbal special.
Food and people are your two biggest expenses. These reports are your best defense against rising costs, giving you the numbers to make smart cuts without hurting service quality. To see how these costs impact your bottom line, plug them into a restaurant profit margin calculator.
For more ideas, various business reporting templates can offer broader insights for long-term planning.
These aren't just numbers; they are answers to your most pressing operational questions. By checking these key reports, you'll stop guessing and start making data-driven decisions.
In this business, margins are everything. A few percentage points on food or labor can be the difference between a profitable month and scrambling to pay suppliers. Your point of sale reporting is the most powerful tool you have to protect those margins.
Instead of cutting based on guesswork, your POS data provides a clear path to smarter spending. It helps you trim waste without sacrificing food quality or the guest experience.
Food cost is a constant battle. Your Product Mix (PMIX) report is your best friend here. It shows every item sold over a specific period. By sorting from least to most popular, you can instantly spot menu items that are collecting dust.
Think about it: if your "Spicy Calamari Appetizer" only sells twice a week, you're likely throwing out unused calamari and sauces. That's cash in the bin.
Action Item: Pull your PMIX report for the last 30 days. Pinpoint your bottom five sellers. If their unique ingredients aren't used in popular dishes, it might be time to 86 those items.
For a deeper dive, check out our guide on mastering restaurant food cost to boost profits.
Labor is your other financial heavyweight. Overstaffing bleeds cash, while understaffing burns out your team. The goal is to match staffing levels to sales volume, and your POS data makes this possible.
Overlay your sales-by-hour report with your weekly schedule. You might discover you have three servers on from 2 PM to 4 PM on a Tuesday when you only do five covers. This data allows you to build smarter schedules, pinpointing exactly when you need an extra line cook or can get by with one fewer server.
Effective optimizing restaurant supply chain management also contributes to overall cost control.
Your menu isn't just a list of dishes; it’s your number one sales tool. With point of sale reporting, you can turn that menu into a profit driver. This is about understanding the relationship between an item's popularity and how much money it actually makes you.
When you pair sales data with each dish's food cost, you can sort every item into a simple framework that tells you what to do next.
This infographic shows how POS data feeds into managing your two biggest expenses.
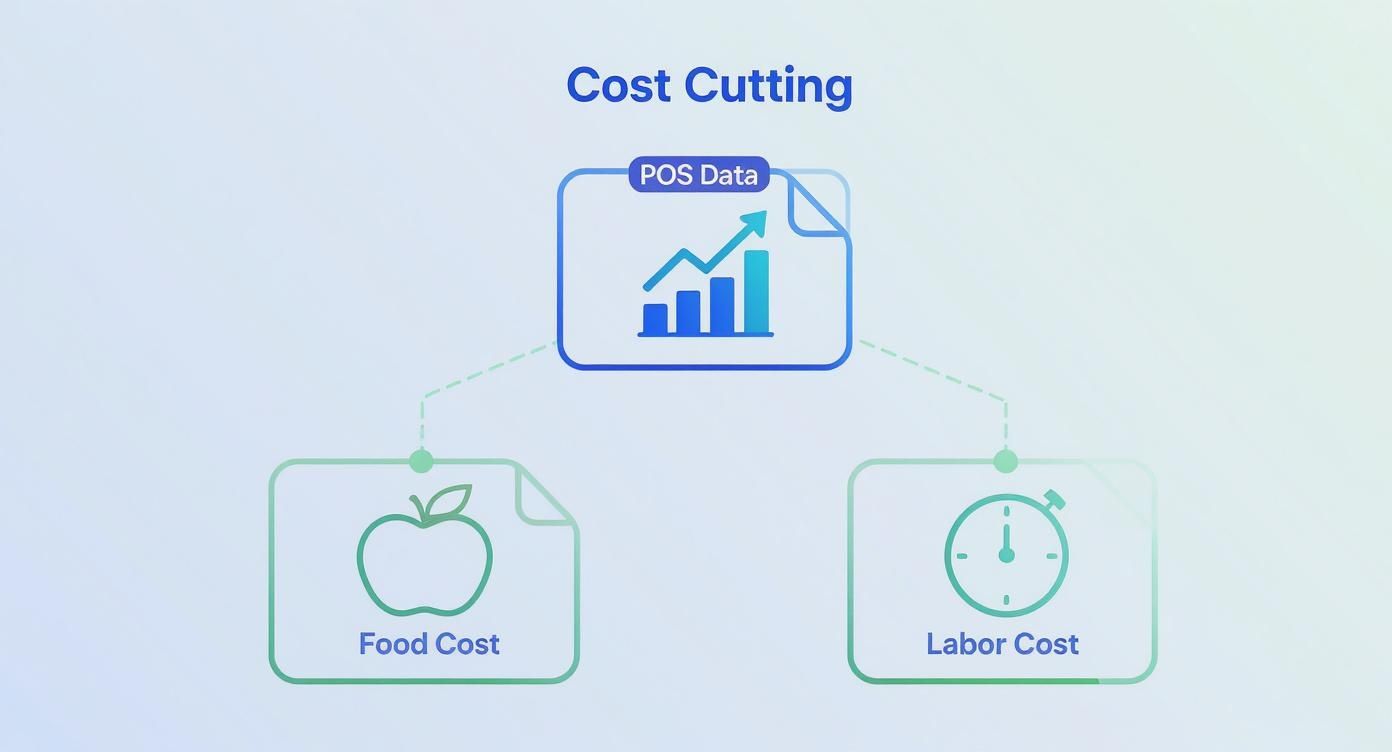
By using sales and inventory data from your POS, you can make targeted decisions that cut waste and fine-tune schedules, directly protecting your bottom line.
Every menu item fits into one of four categories based on profitability and popularity. Your POS sales report gives you popularity, while recipe costing gives you profit.
Quick Win: Pull a sales report for the last quarter. Sit down with your chef and calculate the exact profit margin on your top 10 and bottom 10 sellers. This will instantly reveal your Stars and Dogs.
By consistently looking at your menu through this data-driven lens, you can make small tweaks that have a huge impact on your restaurant's profitability.

Your team is your greatest asset. Point of sale reporting gives you objective insights to lead them, turning performance reviews into productive coaching sessions. This isn't about playing "big brother." It’s about using real numbers to see who your top performers are and who might need more support.
Server-specific reports paint a clear picture of who is driving profitability.
Focus on these three areas:
A server with a consistently high average check isn't just lucky; they're using specific techniques. Find out what those are and turn them into training points for the entire team.
Once you have this data, your management style can shift. Instead of vague feedback, you can have specific, goal-oriented discussions backed by numbers.
For example, notice Sarah’s average check is 15% higher than others? Ask her to share her strategy for describing the dessert menu. This celebrates her success while providing peer-led training.
If Mark’s table turn time is slow, you can review the report with him. The conversation becomes, "Let's look at the data and see how we can make your shift smoother," instead of, "You need to work faster." This approach builds skills and morale.
Not all POS systems are created equal, especially their reporting tools. A clunky, hard-to-read report is useless. The quality and accessibility of point of sale reporting should be at the top of your list when choosing a provider.
A legacy system is like a clunky desktop computer; your information is stuck in the back office. Modern, cloud-based systems are like your smartphone, giving you instant access to critical data from anywhere.
When comparing POS systems, focus on tools that make a real difference in your day-to-day operations.
Here’s a checklist of what matters:
A POS with robust, real-time reporting is a strategic partner. It turns raw data into your competitive advantage.
Choosing the right partner is critical. A system like Peppr's restaurant POS is built with these needs in mind, offering clear, actionable reporting for independent owners. Don't settle for a system that just takes payments; demand one that gives you the intelligence to grow your business.
Even when you get the hang of your data, practical questions pop up. You need straight answers to get the most out of your point of sale reporting without wasting time.
A simple rhythm works best. Get into a daily, weekly, and monthly habit.
If you're just starting out, master one report: the daily sales summary.
This single report gives you the most critical information you need to survive. It confirms your total revenue, payment types, labor costs, and any discounts. It’s the foundational report for your restaurant's financial health.
Work backward from your biggest problem. Don't start with the reports; start with a question.
Instead of asking, "What report should I look at?" ask yourself, "What's the one thing keeping me up at night this week?"
If you feel food costs are creeping up, go to your inventory usage reports. Worried you were overstaffed last Saturday? Pull the sales-by-hour report and lay it over your schedule. Let your biggest challenge guide you to the data that matters most.
Ready to stop guessing and start making decisions with confidence? The right POS system makes this simple. Peppr offers clear, intuitive point of sale reporting designed for busy restaurant owners. See how our tools can help you cut costs, boost sales, and take back control. Explore Peppr's POS solutions.